Fluent Bit is a fast and lightweight log processor, stream processor and forwarder. It’s gained popularity as the younger sibling of Fluentd due to its tiny memory footprint(~650KB compared to Fluentd’s ~40MB), and zero dependencies - making it ideal for cloud and edge computing use cases.
This post is part 2 in a series of posts about logging using Fluent Bit and the Fluentd forwarder in Kubernetes, and it describes the steps to deploy a single-node Elasticsearch as a store for logs, with Kibana for visualization, and Cerebro for health stats.
In Part 1, I shared an overview of the architecture that we’ll deploy in this series, along with the motivation for using Fluent Bit, and why it can be used together with Fluentd in some cases.
Deployment
While the architecture in Part 1 was described left-to-right(in the order of the flow of logs), the deployment will be performed right-to-left(starting from the log store). This is done to avoid Fluent Bit and Fluentd emitting 'destination not found' type errors if their respective destinations did not exist.
Deployment Prerequisites
-
Standalone VM where Elasticsearch/Kibana will be deployed(2 vCPU, 16G RAM, 200G SSD)
-
Kubernetes Cluster - Consider using a Cluster-API provisioned cluster
Installing Elasticsearch
Elasticsearch installation is pretty straightforward with many possible OS targets documented at https://www.elastic.co/guide/en/elasticsearch/reference/current/install-elasticsearch.html. I used the 'RPM-based' method on my CentOS 7 VM.
-
Import the Elastic PGP Key.
rpm --import https://artifacts.elastic.co/GPG-KEY-elasticsearch -
Add the Elasticsearch yum repo to the OS.
cat <<EOF > /etc/yum.repos.d/elasticsearch.repo [elasticsearch] name=Elasticsearch repository for 7.x packages baseurl=https://artifacts.elastic.co/packages/7.x/yum gpgcheck=1 gpgkey=https://artifacts.elastic.co/GPG-KEY-elasticsearch enabled=0 autorefresh=1 type=rpm-md EOF -
Install Elasticsearch.
yum install --enablerepo=elasticsearch -y elasticsearch -
Basic configuration of Elasticsearch.
cat <<EOF > /etc/elasticsearch/elasticsearch.yml cluster.name: logging-devel node.name: ${HOSTNAME} node.attr.role: demo path.data: /var/lib/elasticsearch path.logs: /var/log/elasticsearch bootstrap.memory_lock: true network.host: 0.0.0.0 http.port: 9200 #discovery.seed_hosts: ["127.0.0.1", "[::1]"] cluster.initial_master_nodes: ["${HOSTNAME}"] gateway.recover_after_nodes: 1 action.auto_create_index: true EOF -
Elasticsearch needs to be able to allocate more than the default amount of memory in systemd. Override the defaults:
mkdir -p /etc/systemd/system/elasticsearch.service.d/ cat <<EOF > /etc/systemd/system/elasticsearch.service.d/override.conf [Service] LimitMEMLOCK=infinity EOF systemctl daemon-reload -
Open the firewall to allow traffic into Elasticsearch.
firewall-cmd --add-port=9200/tcp --permanent firewall-cmd --reload -
Enable the Elasticsearch service to start whenever the OS boots, and start the service now.
systemctl daemon-reload systemctl enable elasticsearch.service systemctl start elasticsearch.service -
Elasticsearch by default is configured to run as a cluster to distribute and replicate data for resiliency and search performance. We need to explicitly tell this instance of Elasticsearch not to replicate data, as there is only one node. Elasticsearch clustering is out of scope for this document - further info can be found at the elastic.co site.
Set default replicas to 0 for all indices. (This step is not required if you have configured Elasticsearch clustering outside of this document.)
curl -XPUT \
     -H 'Content-Type: application/json' \
     -d '{"template":"*", "order":1, "settings":{"number_of_replicas":0}}' \
     http://localhost:9200/_template/zeroreplicas
Install Cerebro for an Operator’s UI to monitor Elasticsearch
-
Install Docker and start the service.
yum install -y docker -
Enable the Docker service to start whenever the OS boots, and start the service now.
systemctl daemon-reload systemctl enable docker.service systemctl start docker.service -
Run the Cerebro docker image, exposing it on port 9000.
docker run -d --restart always -p 9000:9000 lmenezes/cerebro -
In your browser, open the URL corresponding to
http://<elasticsearch-hostname>:9000/. In theNode addresstext entry field, enterhttp://<elasticsearch-hostname>:9200(where9200corresponds to thehttp.portvalue in/etc/elasticsearch/elasticsearch.yml).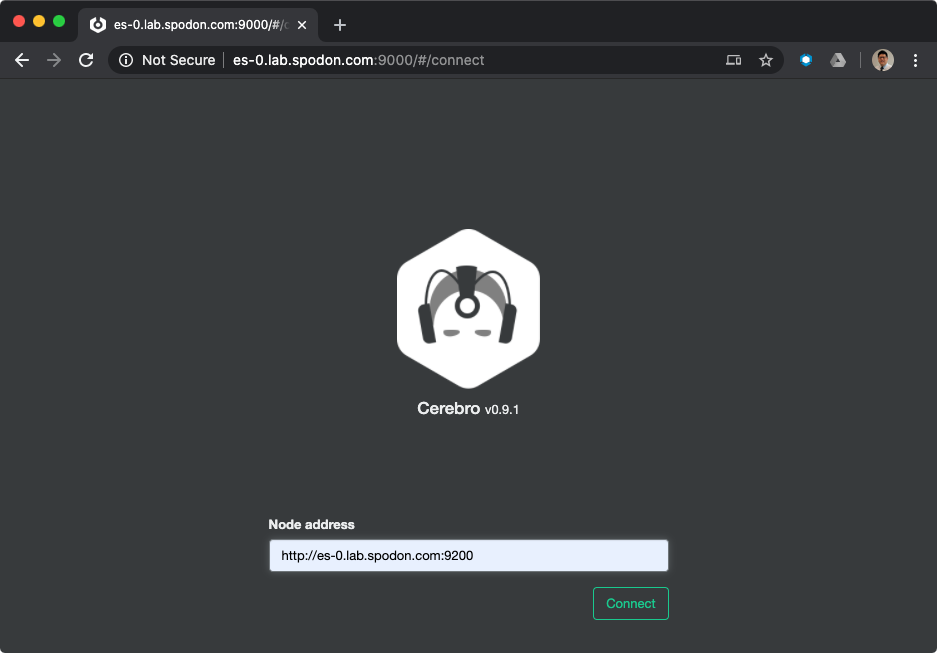
-
At this time, your Cerebro dashboard will be empty, with no indices, but the status should be green. We will revisit this later when data is populated into Elasticsearch.
Installing Kibana
Like Elasticsearch, Kibana installation is pretty straightforward, documented at https://www.elastic.co/guide/en/kibana/current/install.html. I used the 'RPM-based' method on the same VM as I installed Elasticsearch.
-
Import the Elastic PGP Key.
rpm --import https://artifacts.elastic.co/GPG-KEY-elasticsearch -
Add the Elasticsearch yum repo to the OS.
cat <<EOF > /etc/yum.repos.d/kibana.repo [kibana-7.x] name=Kibana repository for 7.x packages baseurl=https://artifacts.elastic.co/packages/7.x/yum gpgcheck=1 gpgkey=https://artifacts.elastic.co/GPG-KEY-elasticsearch enabled=1 autorefresh=1 type=rpm-md EOF -
Install Kibana.
sudo yum install -y kibana -
Basic configuration of Kibana.
cat <<EOF > /etc/kibana/kibana.yml server.host: "0.0.0.0" server.port: 5601 EOF -
Open the firewall to allow traffic into Kibana.
firewall-cmd --add-port=5601/tcp --permanent firewall-cmd --reload -
Enable the Kibana service to start whenever the OS boots, and start the service now.
systemctl daemon-reload systemctl enable kibana.service systemctl start kibana.service -
Verify you can see the Kibana dashboard by navigating to
http://<hostname>:5601/.At this point, the lab setup for Elasticsearch is complete, and we will move left to deploy Fluentd.
Summary
In this post, I shared the steps for deploying a single-node Elasticsearch, with Kibana and Cerebro.
In Part 3 I’ll share the deployment steps for Fluentd and Fluent Bit.